Favorite Books of 2015

Previously: 2007, 2008, 2009, 2010, 2011, 2012, 2013, 2014 This year I read 135 books. You can view most of them on Goodreads. Each year I blog about my favorite books, an idea I got from the incomparable Aaron Swartz. Here are my...

Top 10 Favorite Books Read in 2015

1) The Prom Goer's Interstellar Excursion by Chris McCoy. Wonderful. Sensationally verbally clever. A kid just wants to go to prom and his date is abducted by aliens. What follows is a Douglas Adams-esque comic journey through space.

2) All Involved: A Novel of the 1992 LA Riots by Ryan Gattis. Excellent. Utterly gripping and masterfully written. A terrific book.


3) Trick Baby by Iceberg Slim. "The Sting" appears to rip off major elements of this book! Iceberg Slim was a supremely gifted writer with an amazing ear for dialog and description. It's like reading the best of Kerouac, Ginsberg, or Burroughs.


4) Transcendent Speculation on the Apparent Deliberateness of Fate in the Individual by Arthur Schopenhauer. This is just a long essay, but I found it tremendously insightful and it stuck with me. It delves deeply into the idea that people are the authors of their destinies far more than they often realize.


5) Bright Lights, Big City by Jay McInerney. Sensational. Truly moving. Experimental for a point - the second person narration creates the perfect feeling of dissociation.


6) All the Light We Cannot See by Anthony Doerr. This book lived up to the hype. Such strong, gripping, evocative writing. I keep thinking we're going to run out of stories to tell about World War II, but extraordinary tales keep appearing.


7) Jonathan Stroud - The Screaming Staircase, The Whispering Skull, The Hollow Boy, The Amulet of Samarkand, The Golem's Eye, Ptolemy's Gate, The Ring of Solomon. Just delightful. Really wonderful world-building. The Ring of Solomon might be a perfect book.


8) Bill Bryson - In a Sunburned Country, A Brief History of Nearly Everything, I'm a Stranger Here Myself, A Walk in the Woods, The Life and Times of the Thunderbolt Kid, One Summer: America 1927, Neither Here Nor There, At Home. Charming wit and self-deprecation. A wonderful writer and fascinating on any topic.


9) To Kill a Mockingbird by Harper Lee. I reread from childhood. Extraordinarily great writing. The protagonist is just so loveable - excellently capturing childhood in the South.


10) The Pregnant Widow by Martin Amis. Some moments of true profundity, some moments of great humor and wit, and some moments of unalloyed honesty about the true nature of relationships. Some really beautiful and bittersweet meditations on age, as well. I think this is Amis's parody of "the British novel." It's like an upside down E.M. Forster or Jane Austen.

Oscar Winners by Genre

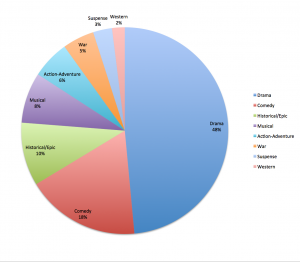
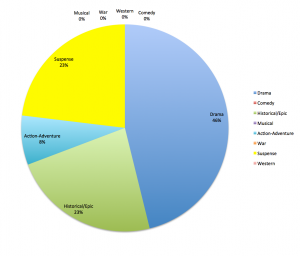
Is it true that dramas are more likely to win best picture than other genres?  I decided to run the numbers.  It turns out, the trend is very true and growing stronger. Best Picture Nominees for 1927 - 2001

(data source: http://www.filmsite.org/bestpics2.html)

Dramas: 48% (click chart to enlarge)

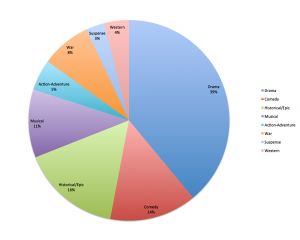
Best Picture Winners for 1927 - 2001

(data source: http://www.filmsite.org/bestpics2.html)

Dramas: 39% (click chart to enlarge)

As you can see, dramas are heavily favored.  But interestingly, the trend grows even stronger in the past dozen years.

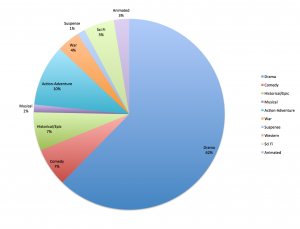
Best Picture Nominees (2002 - 2014)

Dramas: 62% (click chart to enlarge)

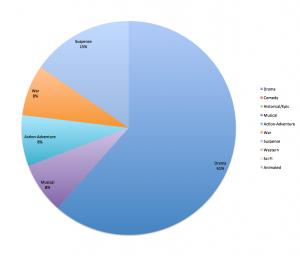
Best Picture Winners (2002 - 2014)

Dramas: 61% (click chart to enlarge)

They might as well call it the Academy Award for Best Drama.  Granted, in 2009, the Academy began nominating as many as 10 movies for best picture.  This allowed Sci Fi movies like District 9 and Animated movies like Up to gain nominations.

Academy Awards for Best Adapted and Best Original Screenplay are similarly weighted toward dramas.  Two-thirds of best picture winners also win either of the two best screenplay awards, so there is a strong correlation.

Best Adapted Screenplays (2002 - 2014)

Dramas: 46% (click chart to enlarge)

Best Original Screenplays (2002 - 2014)

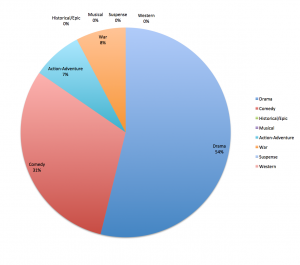
Dramas: 54% (click chart to enlarge)

The upshot here is that if you're looking to win a writing Oscar, it's best to write a drama!

Are Romantic Comedies Profitable?

For years, the film industry has mourned the death of the romantic comedy. According to the Hollywood Reporter, romantic comedies don't travel well to cultures and languages overseas where Hollywood makes at least 75% of its revenue. Furthermore, romantic comedies, by definition, don't lend themselves to sequels. According to the Scoggins Report, there were only two comedy spec screenplay sales in Q1, 2015, neither of which was a romantic comedy.  Studios now rarely invest in rom-coms, as they are no longer considered a profitable genre.

But are these assumptions correct?

Are romantic comedies really an unprofitable genre? And do rom-coms fail overseas?

Looking at the data for all movies released theatrically from 2009 - 2015, romantic comedies are actually extremely profitable both domestically and overseas.  I scraped the available box office data from BoxOfficeMojo.com and crunched the numbers below.

In terms of gross profit, rom-coms handily outperformed my two control groups: action and sci fi.  Net profit is trickier to evaluate, and I will address that below.  But first, the overall numbers:

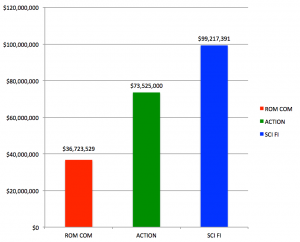
Average Budgets (2009 - 2015)

Rom-coms are significantly less expensive to produce than action or sci fi (click image to enlarge):

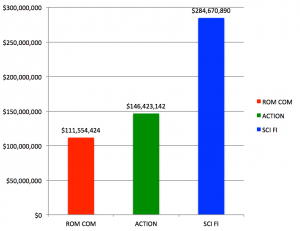
Average Worldwide Gross (2009 - 2015)

The average rom-com earns less revenue than the average action or sci fi movie:

Average Gross Profit (2009 - 2015)

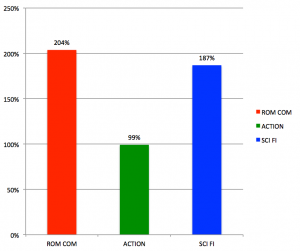
"Gross profit" here is worldwide revenue-divided-by-budget.  For all genres, this number does not account for the exhibitor's split, or P&A (addressed below).

In box office gross, the average romantic comedy is more profitable than either action or sci fi.  In fact, the average rom-com grosses three times its budget.  This is because the rom com budget is typically half that of action movies and one third that of sci fi, so rom-coms are a much smaller financial outlay.  It is worth noting that while studios have avoided rom-coms over the past five years, rom-coms still show a healthy 200% profit margin in this time period, soundly outperforming both action and sci fi.

Studios are run by very, very smart people who wouldn't avoid rom-coms without good reason. So if rom-coms are clearly less expensive and more profitable than action or sci fi movies, why do studios avoid them?

Marketing

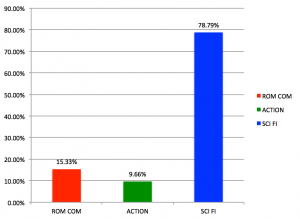
According to Steven Soderbergh, the answer may lie in studio marketing budgets.  If you add a flat $60 million marketing budget to each genre, it radically changes the profit percentages.  In this hypothetical, rom-coms still earn a greater profit than action movies, but nowhere near as strong a profit as sci fi.

We have no transparency on studio marketing budgets, so it's difficult to know what studios spend on marketing and how effectively they spend it.  It seems reasonable to assume that p&a budgets should be dropping as the internet revolutionizes marketing, but marketing budgets continue to sky-rocket.

Consider the fact that 87% of Twitter users claim that tweets influence their movie choices. Yet studios continue to spend more than half their marketing budgets on TV spots in the face of mounting evidence that TV advertising is increasingly inefficient.

Transformers: Age of Extinction spent $100 million on domestic print-and-advertising alone.  Meanwhile, the average studio spends as much as half-a-billion on marketing annually.  With no transparency on these numbers, there can be no critical evaluation.  The MPAA stopped tracking studio marketing spends in 2007, and there is no public breakdown of marketing budgets per movie.

Studios now tend to avoid mid-budget movies of any genre, which cuts out rom-coms entirely. It may be that mini-majors and large financiers may find a way to fill this mid-budget gap in the film ecosystem, and fill the under-served demographic of movie-goers who love romantic comedies. As long as film companies learn to market rom-coms economically, this genre is demonstrably more cost efficient and profitable than action or sci fi.

The big takeaway from the numbers above is that rom-coms actually do perform profitably internationally.  But as studios focus their marketing dollars on fewer movies each year, they are under pressure to invest in gigantic movies that will help them reach billion dollar annual grosses.  Publicly traded companies need to show growing revenue year-over-year, and it is easier for a studio to reach billions in grosses by investing in $200 million movies than in small, yet profitable, romantic comedies.  Perhaps if studios were still privately held, their emphasis might be on greater profitability rather than increasing revenues.

Age Difference Between Leading Actors and Actresses

Much has been made of the age gap between leading men and women.  Male romantic leads are often cast opposite much younger females.  And it is often difficult for actresses to find roles after age 40. While I suspect this gender gap has improved in the past 50 years, I decided to see if it is still alive and well.  I built a spider to scrape age data for the top 5,000 actors and actresses, as ranked by IMDb "starmeter."

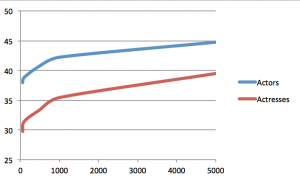
For the 500 most popular actors and actresses on IMDb, the average actor is age 40.77 and the average actress is age 33.39.  Expanding to the top 5,000 actors and actresses on IMDb, the gap narrows.  Here the average actor is 44.74 and the average actress is 39.47.

Not surprisingly, star popularity is correlated to age.  The top 50 actors are the youngest, and possess the largest age gap between men and women.  For the top 5000 actors, the average age is older, and with a smaller age gap.  This chart shows how the age gap narrows as popularity decreases.

Another interesting phenomenon is that 60% of the top 500 most popular stars on IMDb are female.  This trend holds true for the top 100 most popular stars, as well as for the top  50.  Put another way, only 40% of the 500 most popular stars on IMDb are male.

However, when the sample size is stretched to include the 5,000 most popular stars, women equal men almost exactly (50.59% - 49.41%).

So why are women more likely to have high starmeter ratings?  Amazon's starmeter algorithm is a measure of what people are searching for.  A glance at the IMDb message boards suggests IMDb's userbase is disproportionately male.  So it could very well be that men search for their favorite actresses at a higher rate than women search for their favorite actors.  Thus, actresses may have a slight advantage in obtaining top "starmeter" rankings on IMDb.

Actor Height Myths

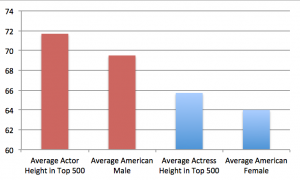
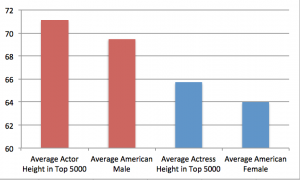
There is a long-standing belief in popular culture that actors are shorter than the national average.  I decided to put the theory to the test, creating a spider to scrape height data for the top 5,000 ranked actors and actresses on IMDb. It turns out: actors and actresses - by IMDb height - are two inches taller than the national average.

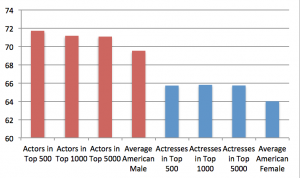
Heights of the Top 500 Actors and Actresses as Ranked by IMDb's "Starmeter."

The top 500 actors average 5 foot 11.7 inches versus the national male average of 5 foot 9.5 inches. The top 500 actresses average 5 foot 5.72 inches versus the national female average of 5 foot 4 inches.  The trend holds for the top 1,000 actors and actresses, as well as the top 5,000.

The easiest explanation is that both actors and actresses are finding ways to over-report their heights on IMDb on a massive scale. However, when I spot-checked a list of famously short actors and actresses, I found no discrepancies between IMDb's numbers, and celebrityheights.com. Granted, I'm not sure how to rigorously fact check 5,000 IMDb actor heights.

If actors are over-reporting their heights, it is worth noting they are no different from the rest of us.  OKCupid found their users report heights two inches above the national average.

The alternative explanation is that successful actors are simply taller.  This success/height correlation should make some sense given the data that taller people are smarter, earn more money, and are more respected by their peers, than short people (I am not a particularly tall person, so I write this without any bias).

The real upshot is, there is no data to support the idea that actors and actresses are shorter than average. In fact, the more popular an actor is, the more likely he is to be tall (actresses, on the other hand, retain a constant height regardless of popularity).

Methodology: Because certain minority groups may be underrepresented in the top 5,000 actors, the charts above compare actors to the average height for American Caucasians.

For my data set, I parsed out actors and actresses under 18, as they may not yet have achieved full height.

"95% of Income Gains to the Top 1%" is a Misleading Statistic

"Obama admits 95% of income gains go to top 1%."

- CNN, September 15, 2013.

Chances are you've seen articles like this pop up in your Facebook news feed, along with angry commenters calling for revolution and storming the Bastille. The statistic conjures images of Mark Zuckerberg and Oprah laughing maniacally as they mug the poor. But take hope...

The 95% statistic is wildly misleading.

And if you put down your pitchforks and torches for a minute, I'll explain the major fallacies behind this statistic.

First, Some Background...

"During the 1980s, the wealthiest 1 percent of Americans got 70 percent of the income gains." - Bill Clinton and Al Gore, Putting People First, 1992.

This statistic helped Clinton beat Bush Sr. in the 1992 election (see page 77 of Alan Reynold's "Income and Wealth" for a thorough smackdown of this erroneous statistic). Awkwardly for Clinton, those same one-percenters made 45% of income gains throughout Clinton's tenure[1].

Bush Jr.'s presidency saw income gains continue to accrue to the nation's richest. Dubyah raised this 1% statistic in the run-up to the Obama-McCain presidential election [2].  In fact, this handy 1% statistic comes up in every election cycle. It even birthed the ninety-nine percent political movement in 2011.

So who are these pesky one-percenters?

The Non-Enduring Class Fallacy

The term "one-percenter" is a non-enduring class fallacy. There is no static class of individuals earning top 1% income gains year-over-year.

In fact, the smaller the percentage we choose, the larger the inaccuracy. Even if we make statements about 100% of Americans, we are not talking about the same individuals each year. People are born, die, or move away. Marilyn vos Savant, who holds a Guinness record for the highest recorded I.Q., made this point in her 1996 book "The Power of Logical Thinking." Berkeley produced the 1% study that currently has Obama in such hot water. But when the IRS and CBO present Berkeley with their raw income data, Berkeley does not get individual names of income gainers. There is no way to track who is in the 1% year-over-year.

So who are those 3.13 million people in this year's top 1%? Are they all palm-rubbing Goldman Sachs partners in $3,000 suits?

Probably not.

And it's not all athletes, artists, and entrepreneurs either.

Imagine a man selling the family farm to pay medical bills. Or an exonerated convict winning a legal judgement. Or a struggling screenwriter selling a script after a decade of waiting tables. The point is we don't know. This year they may be one-percenters. Next year they may be ninety-nine percenters.

So who's making all the money?

Only 63% of Americans are in the workforce. So roughly half the population makes all the money.

Also consider that people at the peak of their careers, age 54 - 64, have the highest income. Hey wait, 12% of the population is making most of the money! That's unfair! Oh wait, no. This makes total sense.

But let's get to the bigger fallacies...

Decile Analysis is Wildly Misleading

The Berkeley study cites decile analysis, which economists use to study income gains. The problem is, decile analysis can be used to say pretty much anything.

To understand why decile analysis is so clunky, consider the ten fictional households of Stokesville:


Let's say the household earner in Decile 9 launches her singing career. She signs a $200,000 recording contract! This poor Decile just made a lot of money, right?

Wrong.

The richest decile did...


...Because our singer jumped to the richest decile.

So the highest decile made a 100% income gain. And the poorest decile made no income gain whatsoever.

And now a journalist can claim the highest income decile made a 100% income gain at the expense of the poor.

Darn those wealthy people for making all the money!


But this is wildly misleading!

Yes. And this is the methodology of the Berkeley study and all other income distribution studies.

And it gets much, much crazier. Consider the following scenario in Stokesville:   Everyone in Stokesville receives a 100% raise. Plus ten new jobs are created for the bottom five deciles!   Everyone wins, right?   Wrong again. According to decile analysis, the top half of Stokesville received 100% of the income gains while the bottom half received zero percent!
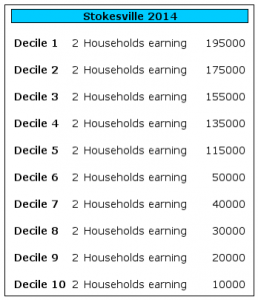
And despite getting equal raises, the top decile's income grew 95%.  More than any other decile.  Gains always accrue to the top decile.

But there are more fallacies to Berkeley's one percent study...

The Biased Sample Fallacy

Why does the Berkeley study only choose the time period of 2009 - 2012? According to their own numbers, the top 1% took 75% of the income losses during the recession of 2007 - 2009. So what are the cumulative numbers from 2007 - 2012? Did the wealthiest 1% only earn 20% of the income gains over that full period? Suddenly this news headline is a lot less sexy.
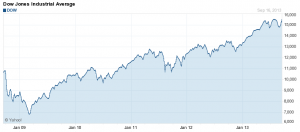
The wealthiest suffer more when the stock market crashes (2007 - 2009) and gain more when the stock market rises (2009 - 2012). The Dow Jones rose nearly 60% from 2009 - 2012 (see chart). Berkeley's choice to only report the income gains of one-percenters during a massive stock market run seems like a biased sample.

And now we get to the main point...

The Median-Mode Fallacy

Consider the following problem:

1) 9 people in Stokesville are 5 feet tall 2) 1 person in Stokesville is 6 feet tall

Therefore, the "average" height in Stokesville is 5 foot 1.

So 90% of the population is below average?

Now imagine a person moves to Stokesville who is 1 million feet tall. Suddenly, everyone is 100,000 feet below average. This is what happens when you introduce a billionaire into an economy…

The Billionaire Dilemma Imagine Stokesville has a total population of 1,000 millionaires. Plus one Warren Buffett (net worth ~ $60 Billion).

The stock market rises 10%. The 1,000 millionaires made $100,000,000! A good year!

But Warren Buffett made $6 Billion. So 98% of the income gains went to the top .001%.

Note the zero-sum fallacy. Everyone in Stokesville is wealthy. Everyone's net worth increased 10%. But a politician can argue that Stokesville is economically unhealthy because the uber-rich are taking 98% of the pie. Gains in the wealthy do not equal suffering in the poor.

Billions and billions…

Adding billionaire outliers to an economy kills income gain analysis. And we are fortunate to live in a country with 442 billionaires and counting. In 2007, before the financial crisis, America boasted 16,600,000 millionaires. That's 5.3% of the U.S. population. In 2007, an American had a one-in-twenty chance of being a millionaire. Even after the financial crisis, America has more millionaires than any other country.

As long as we have great innovators like Elon Musk, Jeff Bezos, Sergey Brin, and Larry Page, then we are going to have billionaires. This is great news. And yes, it will throw off our income gain statistics. It will destroy normal distribution curves and create wonky income studies. But the successes of the wealthy do not necessarily come at the expense of the poor.

Birthday Statistics

Each spring I'm hit by a deluge of birthdays to attend.  The deluge tapers off in July.  This made me curious: are my friends more likely to have spring birthdays?  I did some digging and found the answer: overwhelmingly, yes. First, the control group.  Here are average US birthdays by month (2009 census):

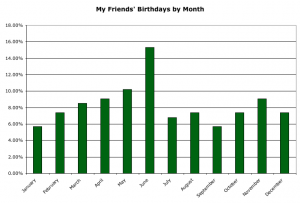
As one would expect, US birthdays average 8.33% per month (as 100% divided by 12 months = 8.33%).  Now, below are my friends' birthdays by month:

Fully 25% of my friends are born in May and June.  And three of my friends share my exact birthday, June 18th.  When you consider the math of the Birthday Problem, this seems unlikely.  What are the odds of four individuals in a set of 167 sharing the exact same birthday?

By way of control group, only two of my other 167 friends share the same birthday with each other.

DATA SET

To obtain the data above, I took my total set of Facebook friends and parsed 180 that I feel a genuine connection with (as many Facebook friends are acquaintances).  Of 180 friendships, I was able to scrape birthday data for 176 of them.  Creating the chart above.

THE BIG QUESTIONS

Why am I nearly twice as likely to have a friend born in the spring than the summer?  Why am I nearly three times as likely to have a friend born in June as a friend born in January?

Is this random chance or do other people notice trends among their friends as well?

THE SCIENCE OF BIRTHDAYS

Turns out, science has spotted many birthday correlations, none of which are properly understood.  For instance, children with autism are 16% more likely to be born in winter months. 1 Spring babies are at a 17% higher risk of suicide.2 A mother's exposure to sunlight (read: vitamin D levels) during gestation may be a significant factor in fetal development. For instance, both MS and Schizophrenia are strongly correlated to babies who came to term during winter months, or in northern latitudes with lower levels of sunlight.1 2 If vitamin D can have such a marked effect on fetal health and development, is it possible that brain and personality may be effected as well? Since photoperiodism can effect the brain chemistry of adults (fully 10% of Alaskans suffer from Seasonal Affective Disorder), can daylight itself be a factor?

Other bizarre birthday statistics:

* US teen mothers are more likely to give birth in January than any other month 3 * February babies have a higher likelihood of narcolepsy 4 * Pilots are more likely to be born in March 4 * People with autumn birthdays have the longest lifespans; spring birthdays have the shortest. A person born in October will outlive a person born in March by an average of 215 days.4 * June and July babies consistently have the highest likelihood of short-sightedness4 *September babies get the best grades and test scores in school.4

Conclusions

I think astrology is malarkey. But is it possible that birth month affects personality? Is my statistical sample of 167 friends simply too small to be meaningful? It is interesting to me that among my very best friends, spring babies are still over-represented, with a distribution mirroring the chart above. Possibly science will begin to formulate explanations for the statistical correlations between birth date and personality, health, and aptitude.

Friendship Equation

Work is preventing me from spending enough time with friends lately.  Rather than deal with this problem head on, I got curious about defining the relationship between friendship and time and came up with the following formula for calculating Friendship Value:

This assumes that Friendship Value = [1. Discounted perceived value of past interactions] + [2. perceived value of current interactions] + [3. discounted perceived value of future interactions]. Working backwards:

3. "Discounted Perceived Value of Future Interactions" can be expressed as the summation of all future interactions (t) years from the present (t=0) where "i" = the discount rate at which the net present value of the opportunity costs of a friendship equals the net present value of the benefits of the friendship:

Or, for those that want to graph friendship as a continuous rate (where d=discount rate and λ = log(1+i) ), by the integration:

2. "Perceived Value of Current Friendship Interaction" may be expressed as:

1. "Discounted Perceived Value of all Past Interactions" may be expressed as:

And thus, total Friendship Value can be expressed as =

By this we see that friendship is in a constant state of entropy, buoyed only by the value of our current interactions and the perceived value of our future interactions.  Without the hope of future interactions, the value of a friendship will decline asymptotally, approaching but never reaching zero.

If the value of perceived future interaction declines, it affects the net present value of the friendship.  So if I am going to be busy for the next six months, this dramatically affects the current value of my friendship.

We can calculate the relationship between time and friendship using an inverse square law:

Where FV1 = The Friendship value of a friend, FV2 = The Friendship value of me, and t = the amount of time spent apart.

By this equation, as the net present perceived value of either or both friends decreases, the force of attraction between the friends drops proportionately. But when time is spent apart, the overall value of the friendship drops exponentially.

Thus, friendship is a function of time.  And if I value friends, logic compels me to leave work alone at some point to spend some time with them. I probably need to get out more.

Math Puzzle

If you have so much time on your hands that you've ended up at this blog, here is a math puzzle I made up... A broker is looking at three stock prices and notices a funny relationship. The three prices are all three-digit numbers. By subtracting the first number from the second number, she gets the same result as subtracting the second number from the third number. By subtracting the inverse of the first number from the inverse of the second number, and subtracting the inverse of the second number from the inverse of the third number, she still receives the exact same answer. Finally, each of the three numbers, minus its inverse, yields the same number (although a different number from the proceeding two operations).

What three numbers was she looking at? (NOTE: if you solve this without using palindromes, the solution is very elegant)

Email me your answer and I will send you a prize!*


*I do not have any prizes.  But you will have my heartfelt admiration.

Wikipedians by Political Party

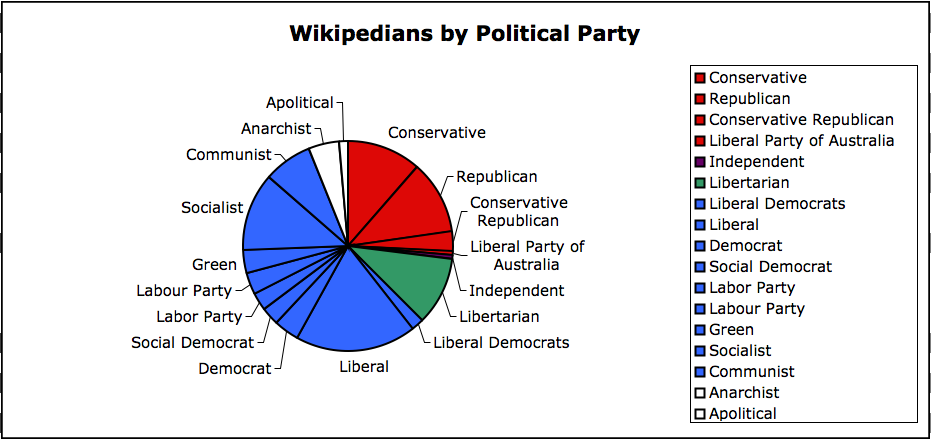
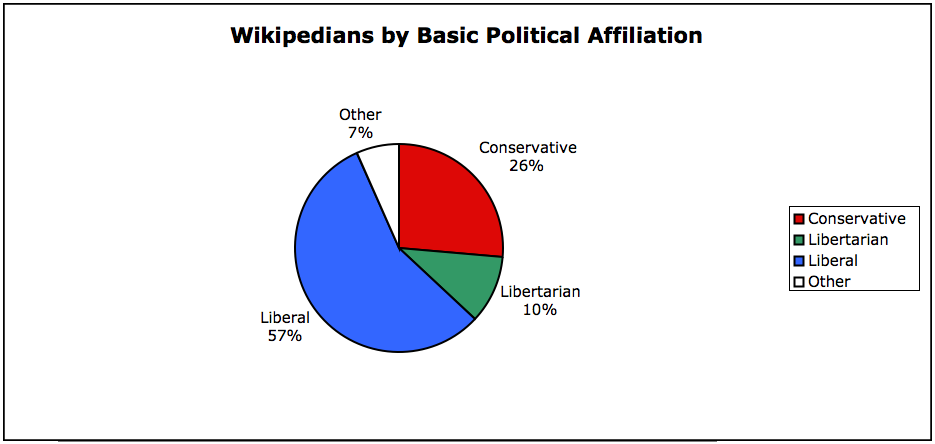
Wikipedia founder Jimbo Wales once said Wikipedians are "more liberal than the U.S. population on average, because we are global and the international community of English speakers is slightly more liberal than the U.S. population." I have crunched the numbers and it appears he is correct.  Wikipedia is more liberal than America.

wikipedians-by-political-party

DATA SET

Of the 14,000,000 registered Wikipedians, it appears 347,000 have created user pages.  Of these 347,000 users, 23,190 individuals, or 6.7%, appear to have professed a political affiliation in the bios on their user pages by mentioning key phrases like "Liberal Party of Australia" or "Social Democrat," etc.  This provides the following data set:

wikipedians-by-political-party-data-set

Liberal, Conservative, and Libertarian Wikipedians

There are some 57 countries where English is the official or de facto language.  Any of these peoples and more may be contributing to the English language Wikipedia.  Lumping together these Wikipedians into four basic categories, we get the following totals:

wikipedians-conservative-liberal-libertarian

These totals contrast the overall US population in three important ways.

  1. Liberals are slightly overrepresented as compared to the US population
  2. Conservatives are decidedly underrepresented as compared to the US population
  3. Libertarians are dramatically overrepresented as compared to the US population

To illustrate the disparity between the American population and the Wikipedian population, here is a chart showing the USA by political party (2008), using data courtesy of ElectionStudies.org:

usa-political-party

Libertarians

What is particularly interesting is the preponderance of Libertarians on Wikipedia.  While Libertarians carried 0.04% of the vote in the latest US presidential election, they carry even less of a vote in other English speaking countries.  Indeed, it is somewhat unclear if any functioning Libertarian party currently exists in any English-speaking country besides the US.  So it is statistically interesting to find 10% of Wikipedians identifying as Libertarian.

Methodology, Notes, and Margin of Error

*This data was assembled using Boolean searches of the seed "en.wikipedia.org/wiki/User:".

*Various search terms were excluded to prevent duplication.  For instance, a UK Wikipedian self-identifying as a "Liberal Democrat" must not be double counted in searches for the terms "Liberal" and "Democrat."  Thus, Liberals were counted as follows:

liberal democrat site:en.wikipedia.org/wiki/user: liberal -democrat -"australia" -philippines site:en.wikipedia.org/wiki/user: democrat -liberal -social site:en.wikipedia.org/wiki/user: Social democrat -liberal site:en.wikipedia.org/wiki/user:

Note that the "Liberal Party of Australia" is center-right, and thus excluded from searches for "Liberal."  Userpages that mentioned both "Philippines" and "Liberal" were excluded as well because while the Philippines has a "Liberal Party" there is no corresponding "Conservative Party" so a fair tally of left-vs-right Wikipedians would have been disrupted.

*"Labor party" and "Labour party" were conducted as separate searches seeing as Wikipedians may belong to the Labor Party in Jamaica, New Zealand, Australia, the UK, etc.

*"Independents" are almost certainly undercounted.  The word "Independent" appears in many contexts in user bios.  Thus, this search only counted "Independent Party."

*Many Wikipedians identify as "Anti-Communist."  So the search for Communist excluded the term "anti."

*Similarly, "Nazi" was not included in this search as so many Wikipedians appear to identify as "Grammar Nazis" or "Deletion Nazis" or "Wikipedians who have been called Nazis by other Wikipedians," etc.

*While India and Pakistan represent massive English speaking populations, their political parties - being somewhat unique and endemic - were not counted in this search.

*Further exclusions could be added to these boolean searches to refine the data.  For instance, a Wikipedian saying, "I disagree with the Labor Party" would be counted as a member of the Labor Party in this methodology.  Nevertheless, it is assumed such search errors would occur equally for all parties and thus keep proportions consistent.  Furthermore, random spot checks for associations like "Hate" & "Labor Party," "Dislike" & "Labor Party," and "Disagree" & "Labor Party," yield zero results.  And moreover, the 6.7% sample size is fairly robust when accounting for margin of error.

Anthropogenic Fibonacci Sequences

DNA measures 34 angstroms long by 21 angstroms wide for each full cycle of its double helix spiral. 34/21 = the Golden Ratio. As folks know, the Fibonacci sequence and its corresponding Golden Ratio can be observed throughout nature, from the arrangement of leaves on a stem to the spiraled florets on the head of a sunflower.  But what about man-made Fibonacci sequences?

Here are some Fibonacci sequences I have observed that are created strictly from humans being human beings:

CHANGI AIRPORT, SINGAPORE 6:00 A.M.

Arriving for an early flight, I witness a terminal opening for the morning.  The first security guard enters the security check.  He walks through the metal detectors, passes his bags through the x-ray, and then runs the metal wand over his body.  Then clips on his security badge.

Thus screened, the first security guard performs the same operation on the second security guard.  While the new guard clips on his badge, the first guard screens a third guard.  Now the first two guards screen two more while the third clips on his badge.

Factoring in the pause time while each newly screened guard clips on his badge and turns on equipment, I realize that the rate at which security guards pass each other through the security check is a Fibonacci sequence.

THE KISSING DISEASE

The incubation period for mononucleosis - the time between exposure to the contagion and the appearance of symptoms - is roughly one month.  Once exposed to the virus, a person carries it for life and can theoretically pass it on for several years.

Thus, imagining a population in which (1) the "Kissing Disease" is introduced by a single person and (2) every person kisses exactly one new person each month, the spread of mono throughout the population is a Fibonacci Sequence.

  1. MONTH ONE: 1 carrier; 1 incubating
  2. MONTH TWO: 2 carriers; 1 incubating
  3. MONTH THREE: 3 carriers; 2 incubating
  4. MONTH FOUR: 5 carriers; 3 incubating

CHRISTMAS FIBONACCI

I witnessed the following Fibonacci Sequence at a Midnight Mass on Christmas Eve.  In a special ceremony, the minister turned off the church lights and distributed unlit candles to every member of the congregation.

The minister's candle was the only lit candle.  He used it to light the first candle in the first pew.  While that person's candle flame gathered strength, the minister lit a second person's candle.  Now two people could light candles while the third person's flame gathered strength.  Soon there were eight people with lit candles and five who could light other people's candles.  Thus the brightness of the dark room accelerated in accordance with the Fibonacci sequence.

Ode to Joy on a Chess Board

How would music appear if played on a chess board? Following comments from my Chess Music post about translating famous chess games into music, a reader requested to see the Ode to Joy on a chess board. Again, mapping algebraic chess notation to scientific pitch notation allows us to play Beethoven on a chess board.

I transposed the Ode to Joy from D Major into C Major for simplicity's sake (apologies to Beethoven). From there, you can see how the notes E, E, F, G, etc, become E3, E6, F3, G3, etc on the chess board.

Note: my chess program automatically flips the chess board every move which makes the video a bit tricky to follow. But you can still get a neat sense of the symmetry of Beethoven's melody showing up visually on the chess board.

Fibonacci Scale

If the Fibonacci sequence (1,1,2,3,5,8,13,21...) were translated into music, how would it sound?  The answer – surprisingly – is, pretty good. Creating the Fibonacci Scale

To play the Fibonacci sequence on a piano, one must assign a number value for every note of the keyboard; A=1, B=2, etc.  As every octave has seven notes, every eighth note starts over at A.  Therefore, 8=A, 9=B, 10=C, etc.  Because there are only 7 possible notes, determining where a given Fibonacci number falls on a scale essentially deals with remainders:

Scale Note = Mod (F,7)

The next, and trickiest step for playing the Fibonacci sequence is finding a piano keyboard that extends into infinity.   Playing only the Fibonacci numbers on your infinite keyboard, one discovers the repeating sixteen note group A-A-B-C-E-A-F-G-F-F-E-D-B-F-A-G (repeat). Expressed numerically (Fibonacci sequence, Modulo 7), the sequence is 1-1-2-3-5-1-6-7-6-6-5-4-2-6-1-7, repeatedly infinitely.

fibonacci-sequence

It's pretty nifty to find an infinite recursive sequence yielding a repeating finite group under modulo 7. But then, the universe is a nifty place.

Playing the Fibonacci sequence on a regular piano (for instance, in one octave of A major) is not unpleasant as the sixteen notes fit squarely into four measures. The sequence begins on the tonic note and ends on the leading tone, musically resolving when the sequence repeats.

It sounds like this: Fibonacci Sequence MP3. Take a listen!

Proving the Finite Group

To prove the Fibonacci sequence under modulo seven has a finite order of sixteen, we can use mathematical induction...  Special thanks to Kiri Wagstaff for helping me with my math!

Since it's known that Fn+1 = Fn + Fn-1, let's assume that:

Mod (Fn+1, 7) = Mod (Fn + Fn-1, 7)

Or in other words:

Mod (Fn+1, 7) = Mod (Mod (Fn, 7) + Mod (Fn-1, 7), 7)

This holds true for our base cases, n = 1 and n = 2.

For our inductive step (to prove the sequence repeats every sixteenth natural number) let's assume that:

Mod (F(n+1)+16, 7) = Mod (F(n+16) + F(n-1)+16 ,7)

OR

Mod (F n+17, 7) = Mod (Mod (Fn+16, 7) + Mod (F n+15, 7), 7)

OR

Mod (2584, 7) = Mod (Mod (1597, 7) + Mod (987, 7), 7)

OR

1 = 1

AND

Mod (Fn, 7) = Mod (Fn+16, 7)

Fibonacci Fugue

Without further ado, here is a fugue I whipped up using the 16 note Fibonacci Scale as the main theme: Fibonacci Fugue MP3. Take a listen!

Order of Group for Non-Western Scales

What does the Fibonacci sequence sound like if played on non-Western scales? Repeating sequences again occur on scales of any length (excepting base 10-divisible scales which spit out gigantic Pisano periods before yielding an identity).  For instance, playing the Fibonacci sequence on a pentatonic scale yields the repeating pattern: A-A-B-C-E-C-C-A-D-E-D-D-C-B-E-B-B-D-A-E.   Playing in a nine note scale also yields a twenty note repeating pattern: A-A-B-C-E-H-D-C-G-A-H-I-H-H-G-F-D-A-E-F-B-H-A-I.

Fibonacci Scales in Bases 2 -15

Examining the modulo sequences, distinct patterns emerge.   The longer the modulo sequence, the more it approaches the Fibonacci sequence.   For instance, all of the sequences begin with 1-1-2-3-5, or A-A-B-C-E.   Furthermore, the sequences all end with the highest possible note in the scale.   Melodically, this means that every sequence begins on the tonic and ends on a leading tone, which is harmonically pleasing.  The second to last note is always A.  The third to last is always the second highest note in the scale.   The fourth to last note is always B, etc.   As larger sequences are generated, greater patterns emerge (see chart above).   Although it must be a mathematical coincidence, these patterns create harmonic consistencies that are not half-bad to listen to.

Perhaps most bizarrely, these Fibonacci scales all appear to obey the laws of musical phrasing.   Simply stated, the peak of a musical phrase is very often the highest note of a musical phrase, and tends to occur around 2/3rds (or maybe .618...) through the length of the phrase.   Furthermore, if a musical phrase begins and ends in the tonic key, the peak of the phrase will often be in the dominant key.   This pattern is bizarrely exhibited in the Fibonacci scales (chart above), which all contain a middle sequence of A-M-N-M-M-L-K, where N is the highest note in the scale, and M is the second highest, L is the third highest, and K is the fourth highest.

Square Scales and Cube Scales

Recurring sequences do not appear to be endemic to the Fibonacci sequence.  Playing the squares (1,4,9, etc) on the infinite piano yields a recurring order of seven {A,D,B,B,D,A,G}.  Playing the cubes (1,8,27) on the infinite piano yields a different recurring group order of seven {A-A-F-A-F-F-G}.   Perhaps these math-based melodies will one day provide inspiration for modern composers.

Chess Music

For absolutely no good reason, I found myself wondering what a chess game would sound like if played on the piano. One can't help but notice that algebraic chess notation maps almost perfectly to scientific pitch notation...

scd_algebraic_notation

The eight columns of a chess board correspond to the eight audible octaves.  E.g., C4 is a middle square on the chess board and C4 is "middle C" on the piano...

pitch_notation

(Both images from Wikimedia Commons).

NOTATION

I know what you're thinking: the diatonic scale has seven notes "A" through "G," but the chess board goes up to "H."  So how can we overlay chess notation with pitch notation?

Fear not!  We'll simply use the Northern European system of musical notation, where an "H" indicates a B Natural, and a "B" indicates a B flat.  This is the notation that composers from Schumann to Lizst used to sign the name "B-A-C-H" into their music (see BACH motif).

The Bach Motif

So we now have a system for mapping the moves of a chess game onto a piano keyboard.  For example, Anderssen's "Immortal Game" begins with 1. e4 e5 2. f4… which maps to E natural in the 4th register, E natural in the 5th register, and F natural in the 4th register.

NOTE VALUE

The remaining task is to assign note values.  What makes a quarter note, a half note, and a whole note?

The relative value of chess pieces is Pawn = 1, Knight = 3, Bishop = 3, Rook = 5, Queen = 9, and King = Infinity.

Assigning these exact ratios to note values will create some rather annoying polyrhythms.  So let's round off the ratios a tiny bit and assign the following note values to the chess pieces: Pawn = 1/16th note, Knight = 1/8th note, Bishop = 1/8th note, Rook = 1/4 note, Queen = 1/2 note, and King = rest.

OCTAVE VALUE

To put the icing on the cake, let's condense the 8 registers into a single octave to make the chess melodies more tolerable. If a note is doubled (as in 1. e4 e5), let's jump the second note up an octave to provide some flavor.

So without further ado, here are three famous chess games mapped onto the piano:

"THE IMMORTAL GAME" June 21 1851

In "The Immortal Game," Adolf Anderssen gave up both rooks, a bishop, and ultimately his queen, in order to checkmate Lionel Kieseritzky using only his three remaining minor pieces - a bishop and two knights.

LISTEN TO THE MP3: The Immortal Game

I set blues chords in the left hand to justify the constant tonal shifts from B to b flat in this chess game. The chords modulate from C Major to F Major and finally end in B Flat Major.

The game/melody: Pe4 Pe5 Pf4 Pe x Pf4 Bc4 Qh4+ Kf1 b5?! Bxb5 Nf6 Nf3 Qh6 Pd3 Nh5 Nh4 Qg5 Nf5 Pc6 Pg4 Nf6 Rg1!! Pcxb5? Ph4 Qg6 Ph5 Qg5 Qf3 Ng8 Bxf4 Qf6 Nc3 Bc5 Nd5 Qxb2 Bd6 Bxg1? Pe5! Qxa1+ Ke2 Na6 Nxg7+ Kd8 Qf6+ Nxf6 Be7#

THE OPERA GAME 1858, Paris

In "The Opera Game," Paul Morphy bested the German Duke Karl of Brunswick and Count Isouard during the Opera "Norma" at the Italian Opera House in Paris.

Morphy won with a snazzy queen sacrifice in what is considered one of the most brilliant combinations in chess history.

LISTEN TO THE MP3: The Opera Game

This bouncy, modal melody seemed to lend itself to a Baroque invention. So I added in a left hand melody using Species Counterpoint.

The game/melody: Pe4 Pe5 Nf3 Pd6 Pd4 Bg4? Pd4xe5 Bxf3 Qxf3 Pdxe5 Bc4 Nf6 Qb3 Qe7 Nc3 Pc6 Bg5 Pb5? Nxb5! Pcxb5 Bxb5 Nbd7 0-0-0 Rd8 Rxd7 Rxd7 Rd1 Qe6 Bxd7+ Nxd7 Qb8+! Nxb8 Rd8#

World Chess Championship 1972, Game 6

Bobby Fischer bests Boris Spassky with an aggressive queenside attack. Spassky joined the audience in applauding Fischer's win and called it the best game of the match.

LISTEN TO THE MP3: Bobby Fischer 1972

This chess game produced a wild jumble of syncopated sevenths and minor seconds. I tried to find order in the atonal chaos by laying in major ninth and suspension chords. My hope was to somehow evoke the major seventh chord sound of the 1970s, when this game was played. It came out sounding like if Schoenberg wrote intro music for a morning talk show.

The game/melody: 1.c4 e6 2.Nf3 d5 3.d4 Nf6 4.Nc3 Be7 5.Bg5 O-O 6.e3 h6 7.Bh4 b6 8.cxd5 Nxd5 9.Bxe7 Qxe7 10.Nxd5 exd5 11.Rc1 Be6 12.Qa4 c5 13.Qa3 Rc8 14.Bb5!? 14...a6?! 15.dxc5 bxc5 16.O-O Ra7 17.Be2 Nd7 18.Nd4 Qf8 19.Nxe6 fxe6 20.e4 d4 21.f4 Qe7 22.e5 Rb8 23.Bc4 Kh8 24.Qh3 Nf8 25.b3 a5 26.f5, exf5 27.Rxf5 Nh7 28.Rcf1 Qd8 29.Qg3 Re7 30.h4 Rbb7 31.e6 Rbc7 32.Qe5 Qe8 33.a4 Qd8 34.R1f2 Qe8 35.R2f3 Qd8 36.Bd3 Qe8 37.Qe4 Nf6 38.Rxf6 gxf6 39.Rxf6 Kg8 40.Bc4 Kh8 41.Qf4 1-0

UPDATE: By reader request, I've translated Beethoven's "Ode to Joy" into a chess game. Click the link to see the video.